Roasting Plant cuts labour cost and frees up GM time with Nory
Cost of labour reduction
-18%
'%3e%3cpath%20d='M370.515%20172.097V335.559C370.515%20344.622%20363.099%20352.037%20354.034%20352.037H247.894C238.83%20352.037%20231.413%20344.622%20231.413%20335.559V195.496C231.413%20154.795%20215.261%20139.471%20190.374%20139.471C161.862%20139.471%20138.129%20156.773%20138.129%20205.053V335.559C138.129%20344.622%20130.712%20352.037%20121.647%20352.037H15.3426C6.2779%20352.037%20-1.1387%20344.622%20-1.1387%20335.559V42.9099C-1.1387%2033.847%206.2779%2026.4319%2015.3426%2026.4319H114.231C123.295%2026.4319%20130.712%2033.847%20130.712%2042.9099V64.3312C157.247%2038.6256%20193.011%2026.4319%20232.237%2026.4319C310.194%2026.4319%20370.515%2069.769%20370.515%20172.262V172.097Z'%20fill='%23140018'/%3e%3cpath%20d='M1082.18%2043.4042V126.453C1082.18%20135.516%201074.76%20142.931%201065.7%20142.931H1040.65C998.783%20142.931%20969.116%20161.386%20969.116%20213.127V335.559C969.116%20344.622%20961.7%20352.037%20952.635%20352.037H846.495C837.431%20352.037%20830.014%20344.622%20830.014%20335.559V42.9099C830.014%2033.847%20837.431%2026.4319%20846.495%2026.4319H945.383C954.448%2026.4319%20961.865%2033.847%20961.865%2042.9099V67.462C980.653%2046.3702%201007.52%2033.3526%201040.32%2028.4092C1043.45%2028.0797%201050.7%2027.5853%201057.95%2027.2558C1060.59%2027.2558%201063.23%2027.091%201065.7%2027.091C1074.76%2027.091%201082.18%2034.5061%201082.18%2043.569V43.4042Z'%20fill='%23140018'/%3e%3cpath%20d='M1469.66%2026.4319C1478.72%2026.4319%201486.14%2033.847%201486.14%2042.9099V287.278C1486.14%20413.5%201414.28%20481.389%201287.04%20481.389C1233.32%20481.389%201180.9%20467.218%201140.69%20447.609C1136.08%20445.302%201131.79%20442.995%201128.16%20440.688C1120.91%20436.074%201118.28%20426.847%201122.23%20419.102L1153.71%20357.804C1157.83%20349.73%201167.88%20346.434%201175.96%20350.718C1179.09%20352.366%201182.39%20354.014%201185.35%20355.332C1210.41%20366.867%201241.89%20373.788%201267.93%20373.788C1323.96%20373.788%201346.71%20349.235%201346.71%20305.898V303.591C1322.15%20324.354%201291.33%20334.735%201258.37%20334.735C1177.61%20334.735%201116.96%20288.761%201116.96%20182.808V43.2394C1116.96%2034.1765%201124.37%2026.7614%201133.44%2026.7614H1239.58C1248.64%2026.7614%201256.06%2034.1765%201256.06%2043.2394V159.409C1256.06%20205.877%201272.54%20221.202%201299.9%20221.202C1323.8%20221.202%201347.2%20203.9%201347.2%20155.619V42.9099C1347.2%2033.847%201354.62%2026.4319%201363.68%2026.4319H1469.49H1469.66Z'%20fill='%23140018'/%3e%3cpath%20d='M600.267%2020.6633C486.546%2020.6633%20404.634%2090.5299%20404.634%20189.068C404.634%20287.607%20486.546%20358.297%20600.267%20358.297C713.989%20358.297%20795.901%20288.101%20795.901%20189.068C795.901%2090.0356%20714.813%2020.6633%20600.267%2020.6633ZM614.112%20253.497C605.706%20254.651%20594.169%20254.321%20582.138%20252.673C548.351%20246.082%20525.607%20222.354%20525.607%20189.398C525.607%20151.004%20556.757%20124.145%20600.597%20124.145C644.437%20124.145%20675.587%20151.004%20675.587%20189.398C675.587%20223.837%20650.535%20248.389%20614.112%20253.497Z'%20fill='%23140018'/%3e%3c/g%3e%3cdefs%3e%3cclipPath%20id='clip0_705_6893'%3e%3crect%20width='1486'%20height='481'%20fill='white'/%3e%3c/clipPath%3e%3c/defs%3e%3c/svg%3e) Book a demo
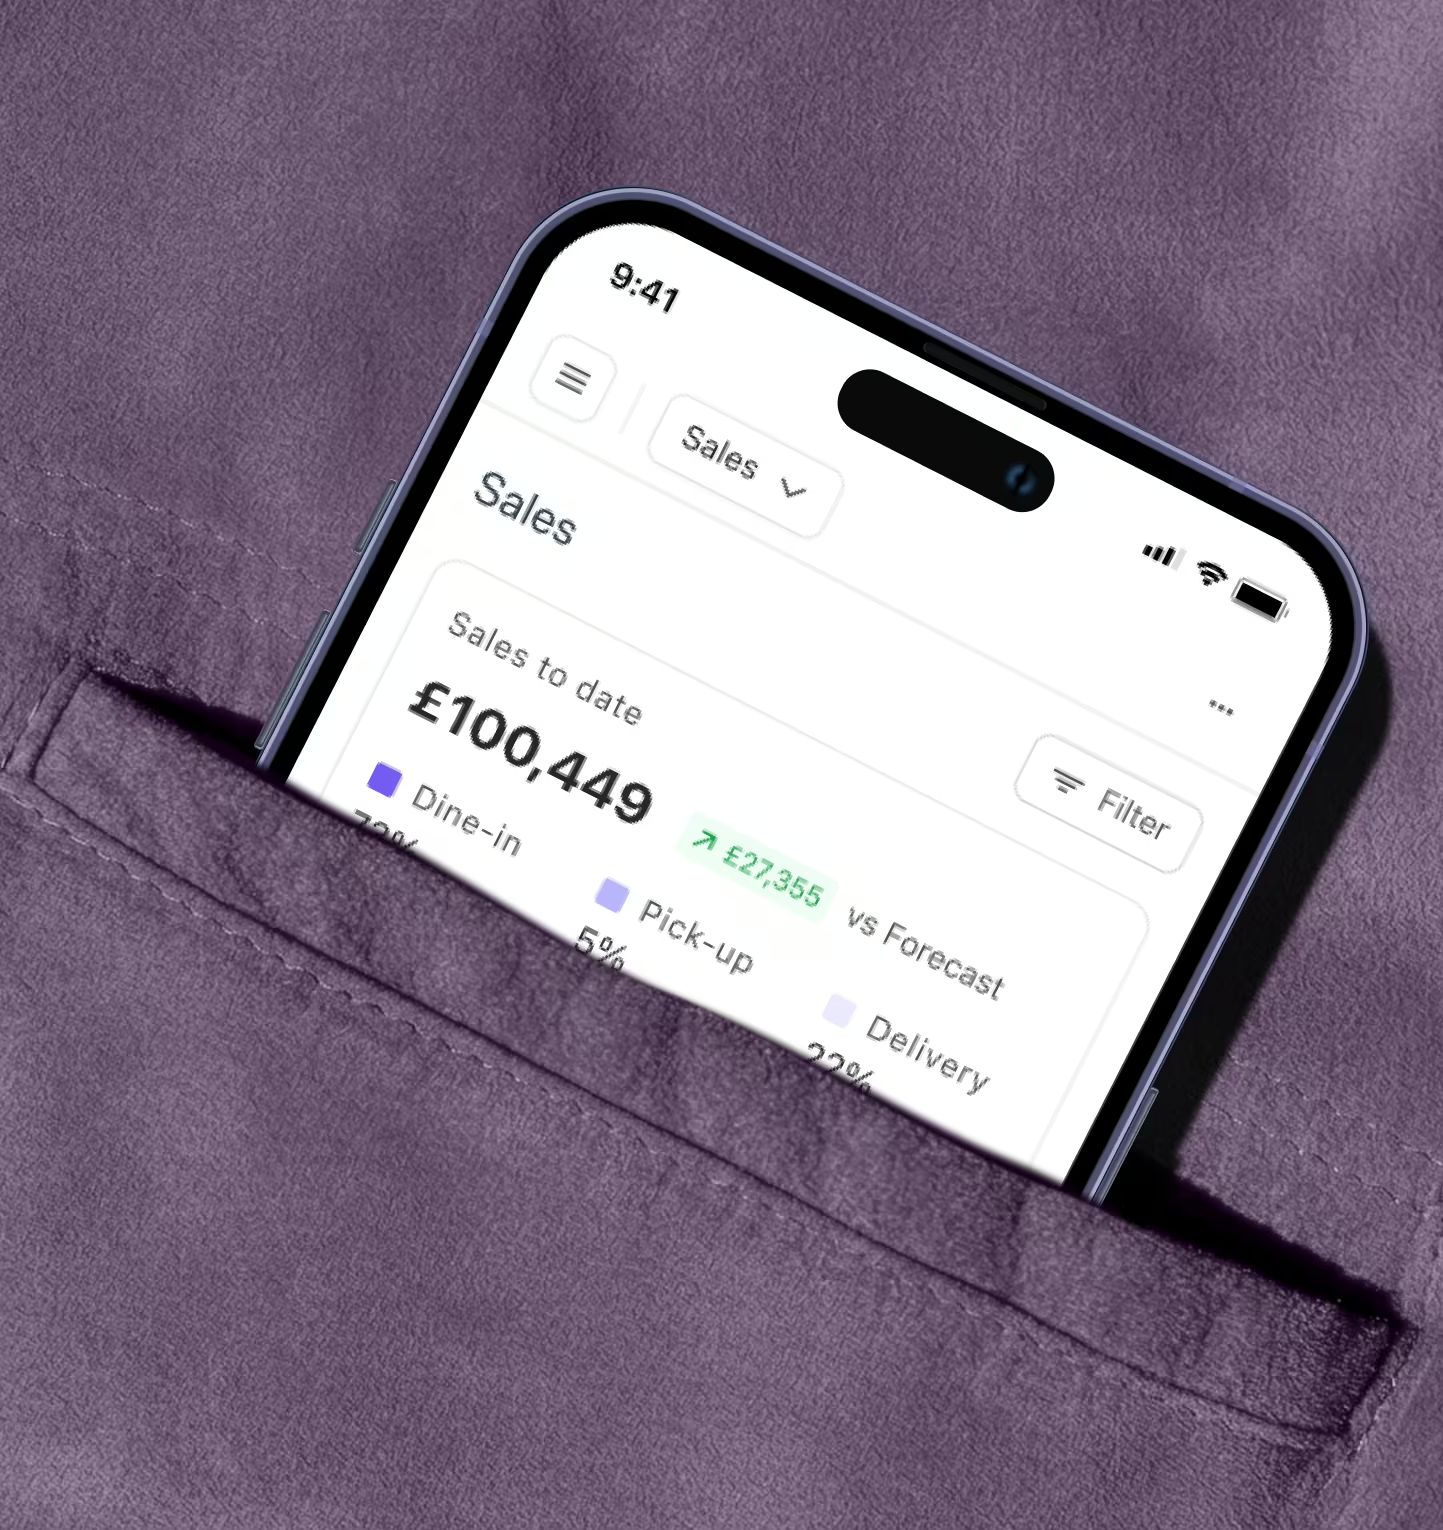
Book a demoNory's restaurant analytics software gives you live GP, labour and sales visibility across every site — plus AI-built forecasts that drive your rotas and ordering before problems reach your P&L.


▸ Waste flagged — Camden
86 actions today
Straight-forward integrations


Your sales sit in the POS. Your labour sits in the rota tool. Your GP shows up at month-end, after the decisions that mattered have already been made. When your operations data isn't live and isn't connected, you're always reacting to last month's P&L.
10–25%
Reduction in cost of labour
Up to
50%
Reduction in food waste
100+
Hours a month of admin time saved

Daily Flash P&L reconciled overnight from sales, labour, COGS and waste. Walk into the morning briefing with the number, not a wait for the accountant.

Sales updated continuously from your POS, compared to forecast hour by hour, broken down by site and day-part. Area managers spot the under-forecast site mid-shift — not the next morning when there's nothing left to do about it.

Planned vs actual labour across every site, updated as employees clock in. Spot the drift on a Wednesday — not on month-end Monday.

Theoretical vs actual usage across every SKU, site by site. The system surfaces the outliers; your team investigates the ones that matter.

Nory's AI analyses guest feedback across every channel and tells you exactly what to fix.

From labour savings to waste reduction — here's what Nory looks like in practice across multi-site groups.
Cost of labour reduction
-18%
Reduction in waste
~60%
Reduction in food waste
60%
Forecast accuracy
98.5%
Want to see what this looks like for your group?
Book a demoRestaurant analytics software is the system multi-site groups use to see — and act on — operational and financial performance across every site. Nory's restaurant analytics software covers live GP and gross margin, labour % vs target by site, sales pace through the day, food waste and variance, stock-on-hand against forecast demand, and a live (not month-end) Flash P&L for the whole group. The point of restaurant data analytics for a multi-site group isn't more charts — it's the ability for an operations team to see what's happening today, while there's still time to fix it.
For multi-site groups, Nory's restaurant data analytics consolidates every site's sales, labour, inventory and waste data into a single live view. Area managers and operations leads can see which sites are running over labour budget right now, which sites are tracking under-forecast on sales, where waste is creeping up, and which managers are hitting target. The data is updated continuously — no overnight refresh, no end-of-week consolidation by a finance team. The same analytics every site sees, every restaurant operations manager sees, every finance lead sees — one source of truth.
Nory isn't restaurant accounting software — it works alongside the accounting software you already use (Xero, QuickBooks, Sage, NetSuite and others). Nory pushes daily revenue, labour costs and stock data into your accounting platform automatically, so your finance team isn't manually reconciling. The difference between Nory and accounting software: accounting tools show you what happened last month after the books close; Nory shows you GP, labour %, waste and sales today, while there's still time to act on them. If your finance team needs clean reconciled month-end numbers, Nory feeds those. If your operators need live decisions during service, that's where Nory works.
Nory's restaurant forecasting uses each site's historical sales by day-part, weather, day-of-week patterns, holidays, local events and promotion calendars to forecast revenue hour by hour. Operators consistently report forecast accuracy in the high 80s to low 90s percent at the daily level for established sites, and the forecast drives downstream decisions automatically — rotas are built from the demand forecast, orders are sized to the demand forecast, prep is paced to the demand forecast. The accuracy compounds: as the AI sees more weeks of your data, the restaurant sales forecast tightens. For new sites, Nory uses comparable-site data from your group to start; the forecast self-corrects over the first six to eight weeks.
A restaurant operations manager working with Nory spends less time pulling reports and more time acting on signals. Instead of asking each site for a daily update, the ops manager opens one dashboard and sees: live labour % vs target per site, today's GP tracking, sales pace, stock variance, and which managers are hitting plan. Variances get flagged automatically — the ops manager doesn't have to go looking for the underperforming site, the site surfaces itself. Forecasts, rotas, and orders are built automatically against the demand curve, so the ops manager isn't rebuilding rotas every week. The role shifts from data gathering to operational decisions — which is what the role is supposed to be in the first place.
When operators compare analytics software for restaurants, the platforms that work for multi-site groups share three traits. First, the data is live — labour %, GP, and sales are visible today, not next Monday. Second, the analytics drive action — forecasts feed rotas, orders, and prep automatically; the platform doesn't just show charts. Third, the system is built around the prime costs that determine restaurant profitability (Sales, COGs, Labour) — not a generic BI tool repurposed for hospitality. Nory's restaurant analytics and forecasting platform is built around all three. The best way to evaluate is a 20-minute walkthrough against your current operating reality.
Get a live walkthrough of the Flash P&L, multi-site analytics and AI forecasts — against your current operating reality.